Thursday, July 29, 2010

http://www.ritholtz.com/blog/2010/07/can-you-correlate/

As I have written previously here and elsewhere, I tend to look at everything through the lens of job creation. What is the correlation of a particular release to the job market, if indeed there is one. Does it lead? Lag? Is it coincident? If I can find a meaningful correlation (say, over 0.70), I figure it’s worth examining more closely. If not, I move on.

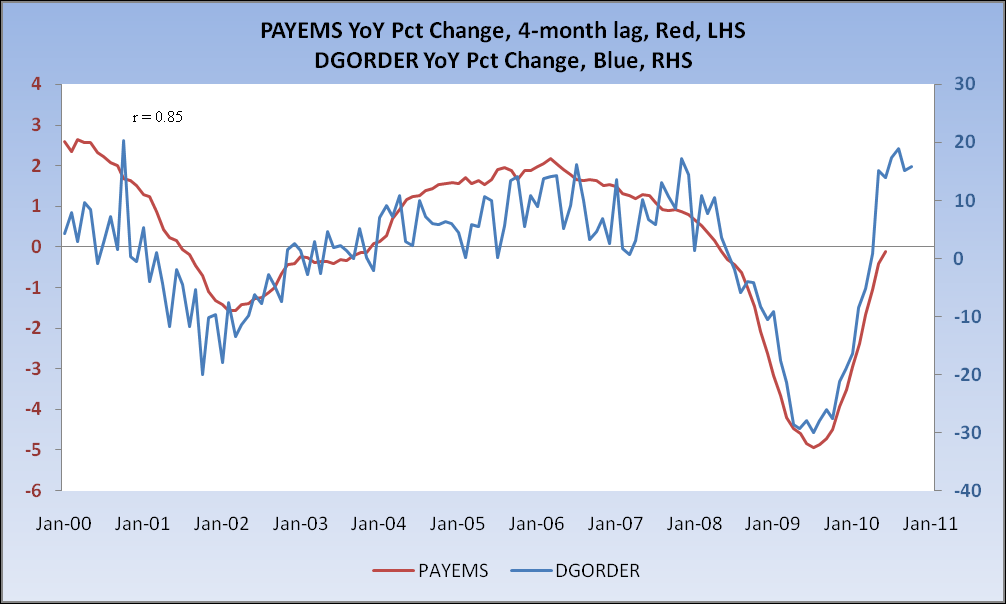
With that in mind, it was off to the drawing board to see what the Durable Goods release might tell me. This is what I found:

>

(Data Source: St. Louis Fed)
>
Durable Goods and Nonfarm Payrolls — both on a year-over-year percentage change basis — have a correlation of 0.85 when payrolls are lagged by four months. Now, the year-over-year change in Durables probably peaked a couple of months ago at 19% (a very rarified level, to be sure). So, to reiterate another point I’ve made both here and elsewhere, comps are going to start getting harder and many metrics are looking decidedly more late-cycle-ish than early-cycle-ish. I fear the hour is growing late and we’re rapidly running out of time as the labor market continues to struggle.

And I see nothing stimulative on the horizon as far as employment goes. I’ll note that next month’s YoY Durables comp is up against a relatively strong number, so look for a sharp decline — a 5% month-over-month gain next month will still bring the year-over-year down to 13.3%, and I don’t think anyone’s looking for 5%.

That’s all sans revisions, of course. I wouldn’t be surprised to see the YoY gain drop to roughly 10%, and it’ll get harder from there . . .

Wednesday, July 7, 2010

good quote

The average person is pretty smart most of the time, except when he/she thinks they can get something for nothing. Then they go stupid.
---dead hobo

Friday, May 21, 2010

trader

Kid Dynamite:
The entire point of "Trading" is to try to do what the "herd" does before the herd does it... it's the object of the entire game/business/market/whatever you want to call it.

Thursday, April 15, 2010

day trading idea

use tick/(money weighted tick) to trade intra-day according to price/tick divergence and over-sold/over-bought condition

Wednesday, April 14, 2010

A good summary of current situation

MrBeach on CR:


I'm beginning to see the method to their madness as well.

History

  1. 2008 - banking system collapsed.
  2. Immediate and full government guarantees hold the system together while a rescue plan is developed.
  3. Rescue options: a) Nationalize (CR hattip: pre-privatize) or b) Support the banks.
  4. Oligarchs pressure Obama to choose B.
  5. Sham stress tests give green light to banks AS IS.
  6. Government officials state they will not allow another Lehman. Banks are now a protected class.
  7. Mark to market changes preserves bank balance sheets from further losses.
  8. QE + ZIRP reduce cost of capital drastically.
  9. Banks go from near death both financially and politically to green shoots.
  10. Stimulus gooses spending

Present

  1. Banks are making little money on their core loan books.
  2. Banks making lots of money on trading.
  3. Banks looking to make loans to the best prospects.

The Hope

  1. As banks feel confident of their earnings power, they will begin to lend more widely

The Doomer Fear

  1. Recovery is not sustainable without government stimulus.
  2. As stimulus fades, recovery will slide.
  3. Currency risk.
  4. Bond market risk.
Rebuttal/comments from:

MrBeach wrote:

2008 - banking system collapsed.
Immediate and full government guarantees hold the system together while a rescue plan is developed.
Rescue options: a) Nationalize (CR hattip: pre-privatize) or b) Support the banks.

If you believe Koo's slides (and I find them very reasonable), Exhibit 16 makes it clear that the choice (b) was driven by the lack of private credit demand. We couldn't have been Swedish if we'd tried.

Government officials state they will not allow another Lehman. Banks are now a protected class.

Except that individual banksters should not have been protected. We were supposed to decapitate before we recapitalized them.

Banks are making little money on their core loan books.
Banks making lots of money on trading.

At the expense of the rest of us!

Banks looking to make loans to the best prospects.
[...]
As banks feel confident of their earnings power, they will begin to lend more widely

You have to look on the demand side of the credit markets as well, though. There just isn't as much demand for credit as there used to be. (There's still some, but on the margins not so much. Remember the old saw: "to get a loan, you must first prove you don't need it"? It's now true again. Unfortunately, those that don't need credit, don't want it. Those that need it and want it, are too risky to lend to!)

The Doomer Fear
Recovery is not sustainable without government stimulus.
As stimulus fades, recovery will slide.
Currency risk.
Bond market risk.

Koo's talk makes it clear that the government will borrow to replace the missing private credit demand, to prevent GDP from crunching downward too quickly. I don't think we need additional stimulus packages at this point, the intrinsic federal deficit is probably enough.
Currency risk is minimal (except vis-a-vis China) since most other countries are in the same pickle and those that aren't, are dependent on trade with those who are. No one can afford to revalue much.

Bond market risk is minimal - see Exhibit 24. People are trending away from being credit-seekers to being debt-averse. Since demand for credit has been crushed and supply of credit far outstrips demand now. A key demographic: the Boomers have to save to retire and the only one willing to borrow more is Uncle Sam. But Uncle Sam will be stabilized against trying to borrow too much, because the government cannot afford its debts if interest rates rise much.

Inflation risk is nonexistent except if we run into the Grecian endgame and people shift over to a Misean crack-up-boom mentality...

MrBeach's rebutt back:

Wisdom Speaker wrote:

Except that individual banksters should not have been protected. We were supposed to decapitate before we recapitalized them.

I have accepted it. It is not a rock that I can move.

At the expense of the rest of us!

See above.

There just isn't as much demand for credit as there used to be.

As confidence returns (however questionable the catalyst), people will return to their free spending ways. Instant gratification is a way of life. As we well know, prudence is not rewarded. Auto sales are returning for example. I'm seeing people return to buying homes in the Bay Area as well as the Westside of Los Angeles.

Koo's talk makes it clear that the government will borrow to replace the missing private credit demand, to prevent GDP from crunching downward too quickly.

Agreed and understood.

Currency risk is minimal

Agreed - except if we see a black swan event somewhere in Europe or Asia.

Does this mean we have new normal? Wisdom Seeker-san?


just some thought on topping`

Trader anonymous is deserted by bears, most left/not-speaking anymore (ben22 and karen) , especially after market pass Karen's top 1100, couple monthes ago, and run up to 1200 today.

The bears there were waiting for P3, which is supposed to be a "great walterfall".

Meaningwhile, Leftback is consoling the bears on trader anonymous

A few thoughts for those who are quietly losing their minds...

1) STAY SOLVENT until this crazy shit is over - don't feed the beast.
2) THE HIGHER IT GOES, the juicier the shorting will be in P3.
3) BANKS and TRASH have to crack before this thing drops.
4) STAY CALM, because we will need all our wits about us for P3.
5) DON'T FORGET #1 - no need to be short all the time... just sit it out.
6) THERE WAS A HAND SIGNAL in March 2009 to say QE: BUY STOCKS.
7) I BELIEVE THERE WILL BE ANOTHER. Listen to the news flow.

Thinking the above is keeping LB sane.

Tuesday, April 13, 2010

short term indicator

1. Aggragate Z-score
http://cssanalytics.wordpress.com/2010/03/19/aggz-another-composite-trendmean-reversion-indicator/


2. DV(2)
http://marketsci.wordpress.com/2009/07/15/varadi%E2%80%99s-rsi2-alternative-the-dv2/

Monday, April 12, 2010

books to read

http://www.ritholtz.com/blog/2010/02/apprenticed-investor-reading-is-fundamental-2/

ridiculous logic?

The more supply, the more buyers?

Back in July of 2005, someone on a web forum about housing prices pointed out that "the more the supply, the higher the prices, because high supply brings out more buyers since there is more selection". What is your opinion of this logic?

Friday, April 9, 2010

Barry Ritholtz's ten suggentions


http://www.ritholtz.com/blog/2010/04/10-thoughts-on-psychology-valuations-adapative-investing/#comments


1. Whether a premise is fundamentally true or false is irrelevant as to whether it is actionable. If enough fools believe something is so, it will impact the markets.

HL: 1. Never fight idiots. Learn to love them

2. Valuation/fundamentals can not be used to trade short-term. Market can remain irrational (overvalued/undervalued) for much longer than I can remain solvent. This reflects my own overconfidence bias


2. Always be conscious of the cognizant biases and selective perceptions you bring to investing. Recognize the same bias in the crowd, the media, and Wall Street. Avoid the herding effect.

HL: How I leave my own bias out of the door when I analyze and invest?

3. After a a 55% market sell off, most of the terrible structural news that existed before the collapse is reflected in prices. (Let it go).

HL: Do not agree. Maybe I do not understand why he says this? Is he a long-biased since he is a money manager, being paid by long/in the market?

4. You must acknowledge when the data gets stronger or weaker, regardless of your current market posture. Be skeptical, but not rigid.

HL: When facts/data changes, I change my mind

5. Variant perception is a rarity; Identifying the moment when the crowd figures out they are wrong is rarer still.

HL: Hard to call top when idiots figure out they are wrong?

6. Market Pros simply cannot afford to sit out a 75% rally; Individuals that miss that sort of move should reconsider their investment strategies immediately.

HL: Money manager's career risk of not being long. So, they have long bias

7. Every thing cycles: Recessions turn into recoveries; bull markets give rise to bear markets. Every rally that there ever was or there ever will be eventually ends. Adapt to this truism or lose all of your money.

HL: We know market cycles, but it does not help timing

8. One of the hardest things to do in investing is to reverse your thinking. It is even more difficult to do after a certain approach has been successful for long time. The longer the period of successful thinking, the more importnat the reversal will be.

HL: Reverse according to what?

9. Cheap markets can get cheaper; Expensive markets can get dearer.

HL: Buying cheap according to value-investing is still a better strategy, collecting dividend, even it get cheaper and cheaper than short a overvalued market in which expensive markets gets dearer to wipe short out for its leverage.

Wally (from BP): Contradictory things (refereing to 6 &9) . The difficulty is that the first thing – a big rally – can only be identified after the fact. If you put your money into what was instead a ‘cheap market’ that got cheaper, you’d be toast and you wouldn’t be around later talking about the big rally. The hardest thing in investing is to look back and identify what you really “knew” as opposed to what you lucked into.

10. The markets frequently diverge from the macro economic environment. This can be both long lasting and maddening; Your job is to be aware of how wide the gap between the two is.

HL: See 1.


Investment fallacy

1. Single source/rumor

2. Correlation/causation

3. Backwards looking---linear extending to future

4. "This time is different"

5. Partial evidence (availability overweight)
5.1 Is three a small number? Is 1mil a large number? It depends on what it refers to.

6. Incentive bias
6.1 Am I predicting what I expect or I want? Are they predicting what they expect/bias to/want to happen?

7. Qualitative vs quantitative


Antidose:
1. Who said, as verified independently, what happened when and where for what reason?

2. How does it look historically? Proportionally? Money weighted wise?

3. Which part/terminology eludes me?

Bob Farrell's ten rules for investing

1. Markets tend to return to the mean over time
When stocks go too far in one direction, they come back. Euphoria and pessimism can cloud people's head. It is easy to get caught up in the heat of the moment and lose perspective.

2. Excesses in one directioni will lead to an opposite excess in the other direction
Think of the market baseline as attached to a rubber string. Any action too far in one direction not only brings you back to the baseline, but lead to an overshoot in the opposite direction

3. There are no new eras--excess are never permanent
Whatever the latest hot sector is, it eventually overheats, mean reverts, and then overshoots. As the fever builds, a chorus of "this time it's different" will be heard, even if those exact words are never used. And of course, it ---Human Nature --- never is different

4. Exponential rapidly rising or falling markets usually go further than you think, but the do not correct by going sideways
Regardless of how hot a sector is, don't expect a plateau to work off the excesses. Profits are locked in by selling, and that invariably lead to a significant correction---eventually

5. The public buys the most at the top and least at the bottom
That's why contrarian-minded investors can make good money if they follow the sentiment indictors and have good timing

6. Fear and greed are strong than long-term resolve
Investors can be their own worst enemy, particularly when emotions take hold.

7. Markets are strongest when they are brad and weakest when they are narrow to a handful of blue-chip names
Hence, why breadth and volume are so important. Think of it as strength in numbers. Broad momentum is hart to stop, Farrel observes. Watch for when momentum channel into a small number of stocks ("Nifty 50" stocks)

8. Bear market have three stages---sharp down, reflexive rebound and a drawn-out fundamental downtrend

9. When all experts and forecasts agree---something else is going to happen
As Stoval, the S&P investment strategist, puts it: "if everybody is optimitics, who is left to buy? If everybody's pessimistic, who's left to sell?"
Going against the herd as Farrel repeatedly suggests can be very profitable, espcially for patient buyers who raise case from frothy markets and reinvest it when sentiment is darkest

10 Bul market are more fun than bear markets
Every so often, exogenous events will cause a major collapse in prices. If you wait for these opportunities, then load up on great companies at cheap price, you will outperform every one.

Stock price direction is a function of several factors: valuation, future expectations, sentiment, and liquidity

Good trader's trait: unemotional, hard-working, and disciplined

Never make a bet you cannot afford to lose

You have to be very decisive, extremely disciplined, relatively smart, and above all, totally independent.

Per ghostfaceinvestor, Lipper is the best source for retail (stock) investors flow

Thursday, October 1, 2009

non-residential and residential construction

5% and 2% for non-residential and residential construction.
But is it true those construction expenditure has spill-over effect, like building a new home leads many other works (wood, concrete, ...) and buying a new home leads buying furniture, appliance, landscaping, etc?

How how big is the spill-over effect quantitatively?

in reference to:

"Dollar-wise, non-residential construction is about 5% of GDP, residential only about 2%. So the even if residential recovers somewhat, a dropping non-residential will be a net drag on the economy."
- Construction Spending increases in August | Hoocoodanode? (view on Google Sidewiki)

Fallacy of non-relative

Angry Saver (profile) wrote on Thu, 10/1/2009 - 11:10 am

Nothing that BB or Timmay does enters into my reality as it's total BS. This is about real business' and people like you and me who simply have no alternative but to


default and add it into the pile

MS,

I missed your initial point. But what your saying makes sense to me. And the data bears your theory out. Private lending contracted in Q2 by > $1 trillion. And Bank credit is lower today than a year ago. So much for the TARP being used to extend credit to small businesses and consumers. That was a such an obvious ruse. But, as usual, it was enough for CONgress.
^^^ The effect of using TARP should be compared with bank-credit shrink/expansion with no TARP. The absolute change (shrink 1T$ in this case) not indicative since it might be a shrinking 5T$ should there was not TARP provisioned.

in reference to:

"Angry Saver (profile) wrote on Thu, 10/1/2009 - 11:10 am


reply
Ignore user


Nothing that BB or Timmay does enters into my reality as it's total BS. This is about real business' and people like you and me who simply have no alternative but to default and add it into the pile
MS,
I missed your initial point. But what your saying makes sense to me. And the data bears your theory out. Private lending contracted in Q2 by > $1 trillion. And Bank credit is lower today than a year ago. So much for the TARP being used to extend credit to small businesses and consumers. That was a such an obvious ruse. But, as usual, it was enough for CONgress."
- Ford reports U.S. Sept. sales fall 5.1% | Hoocoodanode? (view on Google Sidewiki)

Good data/statistics about economy

Jesse Livermore's trading rule as understood by Cory Mitchell

Born in 1877, Jesse Livermore is one of the greatest traders that few people know about. While a book on his life written by Edwin Lefèvre, "Reminiscences of a Stock Operator" (1923), is highly regarded as a must-read for all traders, it deserves more than a passing recommendation. Livermore, who is the author of "How to Trade in Stocks"(1940), was one of the greatest traders of all time. At his peak in 1929, Jesse Livermore was worth $100 million, which in today's dollars roughly equates to $1.5-13 billion, depending on the index used.

The enormity of his success becomes even more staggering when considering that he traded on his own, using his own funds, his own system, and not trading anyone else's capital in conjunction. There is no question that times have changed since Mr. Livermore traded stocks and commodities. Markets were thinly traded, compared to today, and the moves volatile. Jesse speaks of sliding major stocks multiple points with the purchase or sale of 1,000 shares. And yet, despite the difference in the markets, such automation increased liquidity, technology, regulation and a host of other factors that still drive the markets today.

The Test of Time
Given that this trader's rules still apply, and the price patterns he looked for are still very relevant today, we will look at a summary of the patterns Jesse traded, as well his timing indicators and trading rules.

Price Patterns
Jesse did not have the convenience of modern-day charts to graph his price patterns. Instead, the patterns were simply prices that he kept track of in a ledger. He only liked trading in stocks that were moving in a trend, and avoided ranging markets. When prices approached a pivotal point, he waited to see how they reacted.

For instance, if a stock made a $50 low, bounced up to $60 and was now heading back down to $50, Jesse's rules stipulated waiting until the pivotal point was in play in order to trade. If that same stock moved to $48, he would enter a trade on the short side. If it bounced up off the $50 level, he would enter long at $52, closely watching the $60 level, which is also a "pivotal point." A rise above $60 would trigger an addition to the position (pyramiding) at $63, for example. Failure to penetrate or hold above $60 would result in a liquidation of the long positions. The $2 buffer on the breakout in this example is not exact; the buffer will differ based on stock price and volatility. We want a buffer between actual breakout and entry that allows us to get into the move early, but will result in fewer false breakouts.

While Jesse did not trade ranges, he did trade breakouts from ranging markets. He used a similar strategy as above, entering on a new high or low but using a buffer to reduce the likelihood of false breakouts.

Price patterns, combined with volume analysis, were also used to determine if the trade would be kept open. Some of the criteria Jesse used to determine if he was in the right position were:

* Increased volume on breakout.
* The first few days after the break prices should move in the breakout direction
* A normal reaction occurs where prices retrace somewhat against the trend, but volume is lower on retracements than it was in the trending direction.
* As the normal reaction ends, volume increases once again in the direction of the trend.

Deviations from these patterns were warning signals and, if confirmed by price movements back through pivotal points, indicated that exited or unrealized profits should be taken.

Timing the Market
Any trader knows that being right a little too early or a little too late can be as detrimental as simply being wrong. Timing is crucial in the financial markets, and nothing provides better timing than price itself. The pivotal points mentioned above occur in individual stocks and market indexes, as well. Let price confirm the trade before entering large positions.

Jesse Livermore believed no matter how much we "feel" that we know what is happening, we need to wait for the market to confirm our thesis. And only when it does do we make

in reference to:

"Born in 1877, Jesse Livermore is one of the greatest traders that few people know about. While a book on his life written by Edwin Lefèvre, "Reminiscences of a Stock Operator" (1923), is highly regarded as a must-read for all traders, it deserves more than a passing recommendation. Livermore, who is the author of "How to Trade in Stocks"(1940), was one of the greatest traders of all time. At his peak in 1929, Jesse Livermore was worth $100 million, which in today's dollars roughly equates to $1.5-13 billion, depending on the index used.


The enormity of his success becomes even more staggering when considering that he traded on his own, using his own funds, his own system, and not trading anyone else's capital in conjunction. There is no question that times have changed since Mr. Livermore traded stocks and commodities. Markets were thinly traded, compared to today, and the moves volatile. Jesse speaks of sliding major stocks multiple points with the purchase or sale of 1,000 shares. And yet, despite the difference in the markets, such automation increased liquidity, technology, regulation and a host of other factors that still drive the markets today.The Test of TimeGiven that this trader's rules still apply, and the price patterns he looked for are still very relevant today, we will look at a summary of the patterns Jesse traded, as well his timing indicators and trading rules. Price PatternsJesse did not have the convenience of modern-day charts to graph his price patterns. Instead, the patterns were simply prices that he kept track of in a ledger. He only liked trading in stocks that were moving in a trend, and avoided ranging markets. When prices approached a pivotal point, he waited to see how they reacted.For instance, if a stock made a $50 low, bounced up to $60 and was now heading back down to $50, Jesse's rules stipulated waiting until the pivotal point was in play in order to trade. If that same stock moved to $48, he would enter a trade on the short side. If it bounced up off the $50 level, he would enter long at $52, closely watching the $60 level, which is also a "pivotal point." A rise above $60 would trigger an addition to the position (pyramiding) at $63, for example. Failure to penetrate or hold above $60 would result in a liquidation of the long positions. The $2 buffer on the breakout in this example is not exact; the buffer will differ based on stock price and volatility. We want a buffer between actual breakout and entry that allows us to get into the move early, but will result in fewer false breakouts.While Jesse did not trade ranges, he did trade breakouts from ranging markets. He used a similar strategy as above, entering on a new high or low but using a buffer to reduce the likelihood of false breakouts. Price patterns, combined with volume analysis, were also used to determine if the trade would be kept open. Some of the criteria Jesse used to determine if he was in the right position were:

Increased volume on breakout.
The first few days after the break prices should move in the breakout direction
A normal reaction occurs where prices retrace somewhat against the trend, but volume is lower on retracements than it was in the trending direction.
As the normal reaction ends, volume increases once again in the direction of the trend.

Deviations from these patterns were warning signals and, if confirmed by price movements back through pivotal points, indicated that exited or unrealized profits should be taken. Timing the Market Any trader knows that being right a little too early or a little too late can be as detrimental as simply being wrong. Timing is crucial in the financial markets, and nothing provides better timing than price itself. The pivotal points mentioned above occur in individual stocks and market indexes, as well. Let price confirm the trade before entering large positions.Jesse Livermore believed no matter how much we "feel" that we know what is happening, we need to wait for the market to confirm our thesis. And only when it does do we make our trades - and we must do so promptly. Trading RulesThe trading rules that follow are simple, and have been included in many trading plans by many traders since they were created nearly a century ago. They are still valid today, and were created under Jesse's truism: "There is nothing new in Wall Street. There can't be, because speculation is as old as the hills. Whatever happens in the stock market today has happened before and will happen again."

Trade with the trend. Buy in a bull market, short in a bear market.
Don't trade when there aren't clear opportunities.
Trade using the pivotal points.
Wait for the market to confirm opinion before entering. Patience leads to "the big money."
Let profits run. Close trades that show a loss (good trades generally show profit right away).
Trade with a stop, and know it before you enter.
Exit trades where the prospect of further profits is remote (trend is over or waning).
Trade the leading stocks in each sector; trade the strongest stocks in a bull market, or the weakest stocks in a bear market.
Don't average down a losing position.
Don't meet a margin call; close the position instead.
Don't follow too many stocks.

Summing Up Jesse Livermore's StrategyJesse was highly successful, but also lost his fortune several times. He was always the first to admit when he made a mistake, and when he lost money it came down to two potential culprits:

The rules for trading were not fully formulated (not the case for most of his losses).
The rules were not followed.

For today's trader, these are still likely the culprits that keep profits at bay. To be profitable, we must actually create a profitable trading system, and then we must adhere to it in actual trading. Jesse outlined a simple trading system for us: wait for pivotal points before entering a trade. When the points come into play, trade them using a buffer, trading in the direction of the overall market. Let the price dictate our actions and stay with profitable trades, until there is good reason to exit the trade. Losses should be small and trading should be avoided when there are no clear opportunities. When there are trading opportunities, trade stocks that are most likely to move the most."
- Jesse Livermore: Lessons From A Legendary Trader - Yahoo! Finance (view on Google Sidewiki)

Wednesday, September 30, 2009

Disucssion on FDIC examiners to banks

Terry says:
[message/possible fact/rumor]Talking to bankers, the examiners continue to press for more "mark-to-market" on loans that the banks intend to hold to maturity, for a capital level of about 12% TCE (not Tier 1), and for a big cash kick-in to the FDIC to fund the DIF.[His own or his friends' view?] Only ways to get there are to raise more capital, sell assets or to cut credit, including consumer, commercial and construction. There is going to be no one left to fund conusmer purchases, inventory purchases and capex expenditures.

Basel Too says:
Several community banks down here recently announced suspension of dividends. Another bank raised capital for "FDIC-funded expansion"...

Terry replies:
That works, too, but does not lead to a willingness of investors to put up more capital. Also, this is a frequent item addresses in the non-public MOUs with the regulators - wonder how many of these banks are under MOUs that may ripen to C&Ds?

some investor guy replies to Terry's "Only ways to .."
Terry, it's not just banks that can fund these things. People can pay cash. They can sometimes borrow from nonbanks (has anyone seen VC or PE lately?). There is this new/oldfangled thing called lay a way. I wouldn't be terribly surprised to see more barter.


Terry replies:

Regarding an earlier post on replacing bank lending with PE/VC money - not easily done for many industries, as the PE/VC wants to know the exit strategy, be it a sale or public offering. Valuations are also important.

Even for VC/PE funded companies, my contacts have said that they are being less free with giving additional funding to portfolio companies - they want the insiders to be squeezed first.

For many businesses, the VC/PE window is closed.

in reference to: Chicago Purchasing Managers Index Declines in September | Hoocoodanode? (view on Google Sidewiki)

Tuesday, September 29, 2009

layoff catch up

Citizen AllenM reporting "management shakeup has started".


somewhat OT but interesting post about Palm:
Pre faltering, Palm laying off employees? – UPDATES

in reference to: Survey: Home Purchase Market by Homebuyer Category | Hoocoodanode? (view on Google Sidewiki)

Monday, September 28, 2009

Good critical thinking example by Dan Duncan

1. Check the facts
2. No TA analysis without thorough historical view AND clear fundamental explanation

Full text:

Full text:
“Indeed, rather than investigating these common aphorisms, if you trade on them at face value, you will be disappointed. Unless you thoroughly data verify and prove/disprove ANY AND ALL Wall Street myths, rules of thumb, or standard trading phrases, you are going to a) develop a false belief system and 2) that will eventually lose you lots of money.”

Barry, you’re just as guilty when you throw out the standard technical analysis B.S. with no underpinnings. Hell, just last week you were noting the significance of the dreaded “outside down day”…Oh no!

Taking the Dreaded Outside Down day as an example (one of many—like Head shoulders, MA crossovers and on and on.)–and your time-tested advice to “data verify”…

Just what exactly is the significance of the Outside Down Day? [And please, no garbage narratives...just the facts.]

1. How often are outside days (up or down) followed up by a move in the same direction? Could you give us a little feedback on this…you are a part of Fusion IQ, after all, so it couldn’t be too difficult.

2. Would the results of #1 be affected by the enactment of a reasonable stop-loss plan? [It is so damn annoying when people make market calls and then take credit for a particular call even the trade would have been stopped out by a normal enforcement of a stop loss protocol.]

3. Any ideas as to how long the affects of the Outside day will last on a particular market movement..ie should the trader stay in trade for 1 day or should the occurrence of an outside day mark the beginning of a long term trade?

4. If you don’t know the answer to #1 (let alone 2-4), why on earth are you mentioning the occurrence of an outside day as if it has any significance whatsoever? If you do know the answer, wouldn’t your readers find it interesting?

5. Finally, and most importantly: Are you impressed by my willingness and desire to “thoroughly data verify and prove/disprove ANY AND ALL Wall Street myths, rules of thumb, or standard trading phrases”?

in reference to: The Myth of Sideline Cash | The Big Picture (view on Google Sidewiki)